JACOB MORTENSON

Are "deficits" still above the pre-Great Recession trend?

10/12/2015

6 Comments

 
Twitter is a great place to be wrong, because smart people often correct you in real time. That happened yesterday, when I commented on this graph tweeted by David Andolfatto:
Picture
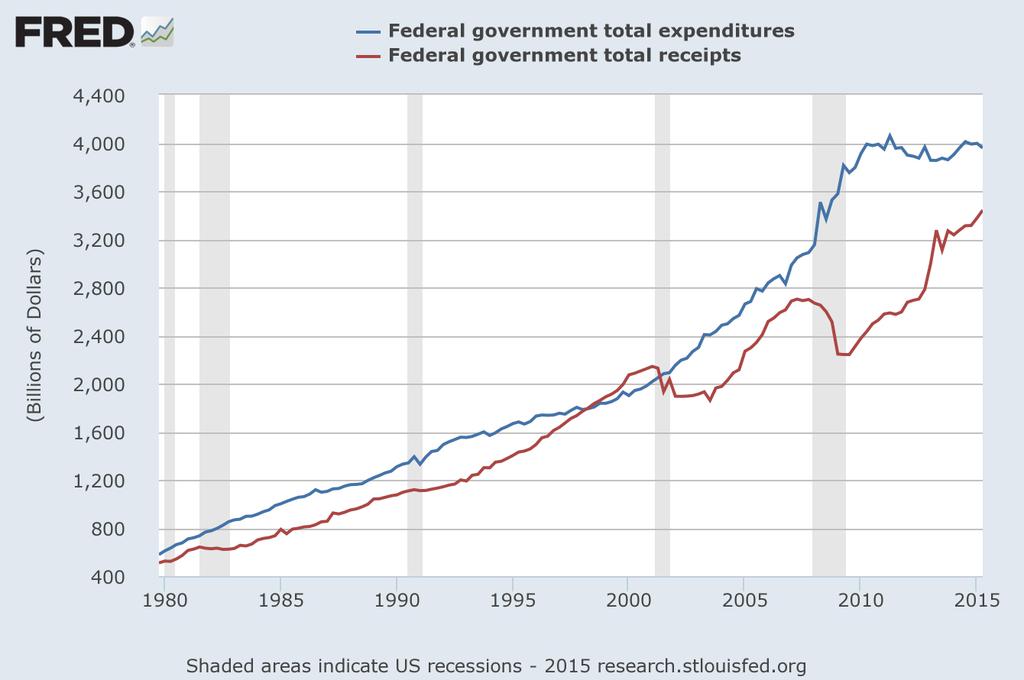
Nominal federal government expenditures over time are plotted along with nominal federal receipts.

Noah Smith (and David, at least implicitly) was making the case that net government outlays had returned to pre-Great Recession trend. I suggested that the current levels remained above trend despite spending growth being negative in real (inflation adjusted) terms. David suggested I check the same graph out in real, per capita terms. 

This seemed like a good opportunity to work with some macro data, which I rarely do, and add an inaugural post to my blog. Here is what I did to create the graphs below:
  • Downloaded federal government expenditures, total expenditures, federal government receipts, state and local receipts, consumer price index less food and energy, and U.S. population from the St. Louis Fed's FRED data.
  • Normalized the dollar denominated variables to be in 2014Q4 dollars.
  • Normalized the now "real" dollar denominated variables to be in per capita terms.
The egg timer went off on this project before I could make these graphs pretty, but here the graphs of real per capita federal expenditures and receipts (plus the same for federal+state+local):
Picture
Picture
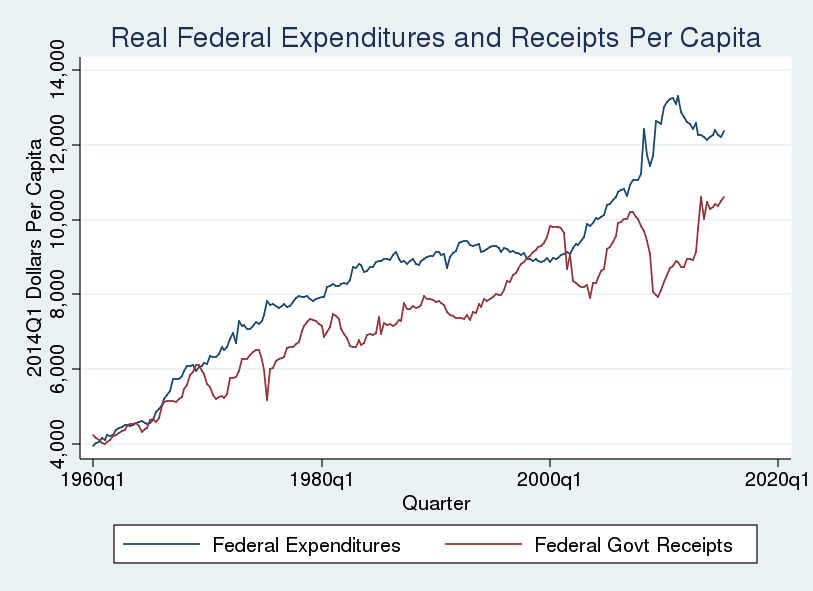
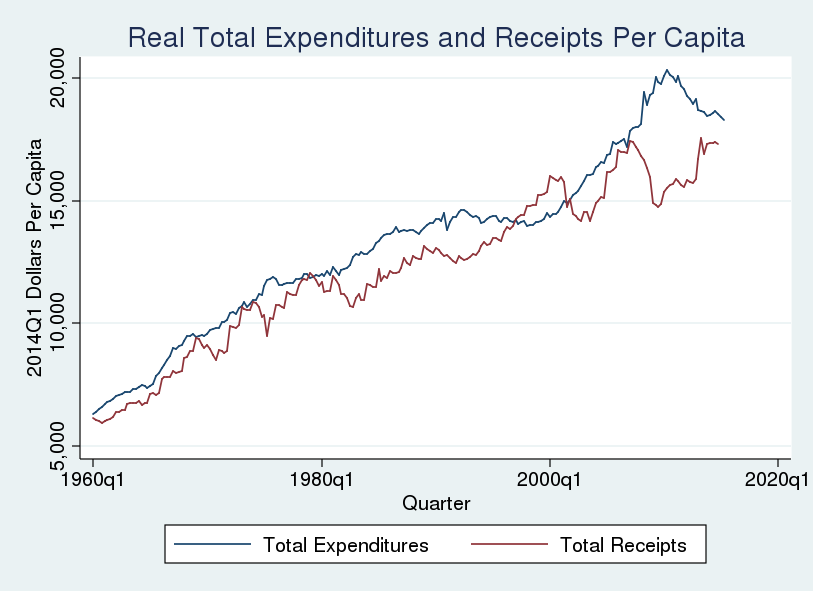
These graphs tell basically the same story as David's. It is obvious the Great Recession generated large deficits, and that those deficits have shrunk in the years following the stimulus response. But how large are current deficits relative to those before the Great Recession? To better answer that question I graphed the difference between real per capita expenditures and real per capita receipts.
Picture
Picture
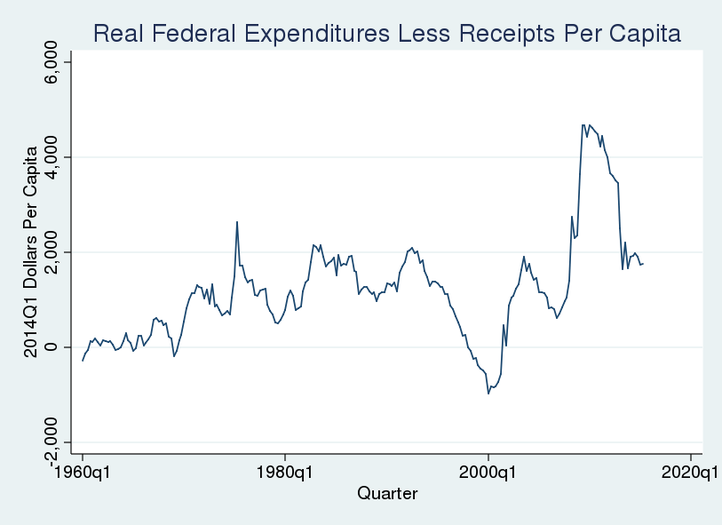
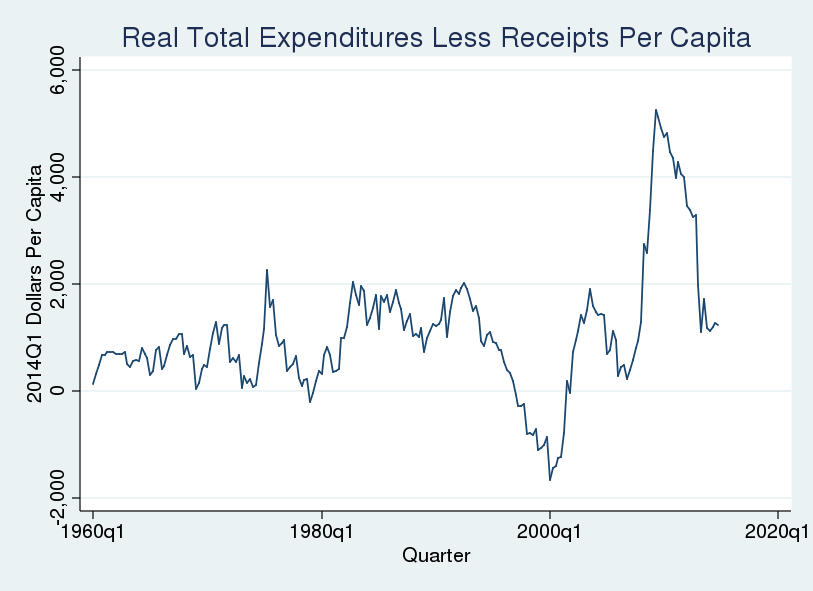
What do these graphs tell us? The real per capita surpluses at the end of the last century represented a substantial deviation from the trend beginning in 1960. Similarly, the deficits during the Great Recession were substantial. And deficits in recent quarters are approximately at the levels of 1980s (AKA the Reagan Glory Years).

This means my "eye-balling a graph while leaving a winery after moderate day-drinking" self was wrong: we have returned to deficits that are roughly on trend.

Mea culpa

--------------------------------------------------------------------------------------------------------------------------------------------------------

A few notes on the construction of these graphs:
  • The data and stata .do files are included below.
  • There isn't a total receipts variable, and the state & local are only reported annually.
  • As a result, the "total" data (federal + state & local) only run through Q4 of 2014.
  • The federal data are through Q2 of 2015.
Perhaps someone more fluent with FRED data could accomplish this within FRED. Feel free to let me know if there are better FRED (or other) data series to use to address this topic.
blog151012.do
File Size: 3 kb
File Type: do
Download File

blog151012.xls
File Size: 78 kb
File Type: xls
Download File

6 Comments
Marko
10/15/2015 03:18:31 am

Here's annual change in gov't debt per capita in 2010 $ , which is a rough match to your last graph.

https://research.stlouisfed.org/fred2/graph/?g=29aV

Reply
best essay writing service uk link
3/9/2020 06:34:56 am

The government is never going to do anything good. I feel like people need to know what the government is all about at this point. I feel like people just have no real idea what life is going to be about. If you ask me, we just need to think about how we can make life a little bit better for ourselves, even if the government is not there for us. We just have to make due with what we have.

Reply
Jake
10/15/2015 09:55:05 am

Thank you, Marko. Really similar story. I suspected you could create those kinds of graphs using FRED, but am fairly unfamiliar with it at this point.

A related question: will Keynesians who argued loudly for stimulus during downturns argue equally loudly for surpluses during expansions?

Reply
Marko
10/15/2015 07:19:32 pm

Jake ,

I don't know if I can speak for all Keynesians , but I think Keynes himself would have argued that expansions should be used to regain the ground lost during downturns. That doesn't necessarily mean running surpluses , but it certainly does mean running smaller deficits.

Let's say you want to maintain the current gov't debt/gdp level indefinitely. That requires that the growth of debt , on average , progresses at the same rate as the growth of nominal gdp. If nominal gdp averages 4% over the long haul , then you can grow your debt at 4% over the long haul and maintain a constant dbt/gdp ratio.

In practice , using the same example , you might expand your debt stock ( i.e. run bigger deficits ) at 6 or 7 % during downturns , requiring that you then run smaller deficits during expansions to rebalance , maybe 0-2% , but surpluses are not an absolute requirement to attain your goal of stable debt/gdp.

Now , if our current debt/gdp is 100% , but we'd prefer a ratio of , say , 50% over the long haul , then you'd need to make an adjustment. If nominal gdp grows at 4% , then you'd need to maintain an average growth rate of debt below 4% in order to eventually converge on that 50% debt/gdp level. How far below 4% would be determined by how fast you want to reach that target.

Reply
Jake
10/15/2015 08:12:18 pm

Yes, great point, Marko. Path of fiscal policy ultimately depends on nominal gdp growth and th`e targeted debt/gdp ratio. Surpluses not necessary.

Reply
Arnold link
12/30/2020 01:38:01 pm

This was a lovely blog posst

Reply


Leave a Reply.

    Author

    See my research page for working papers and publications.

    Archives

    November 2015
    October 2015

    Categories

    All

    RSS Feed

Proudly powered by Weebly